For the Linux version of Superluminal we rely on unwind information stored in the .eh_frame section in a binary to perform stack unwinding. It is critical that we extract this unwind information from a binary as fast as possible. In this article, we’ll go over some optimizations made to libdwarf that greatly improve the performance of this step.
Table of Contents
Open Table of Contents
What is it, and why do we care
(If you’re already familiar with .eh_frame, skip to Baseline)
Superluminal is a sampling profiler. It periodically captures a stack trace to answer questions like “Where is the program spending its time”, and “How did we get here?”.
To capture the stack trace, we make use of the unwind information stored in the .eh_frame section of a binary. This section, and the information in it, was originally created to support exceptions in C++: when an exception is thrown, the exception handling machinery needs to be able to unwind stack frames until an exception handler is found without relying on debug information.
The goal of this information is to answer the question: given the current register state, what would the register state become if the current function were to immediately return and resume execution in its caller?
For example, let’s take a function that looks like this (in disassembly):
push rax    ; store current value of rax on the stack; stack pointer is decremented by 8
push rbx    ; store current value of rbx on the stack; stack pointer is decremented by 8

; ... modifications to rax/rbx go here ...

pop rbx     ; restore previous value of rbx; stack pointer is incremented by 8
pop rax     ; restore previous value of rax; stack pointer is incremented by 8

ret
And let’s assume the instruction pointer is currently at address 4 when an exception happens. To ‘unwind’ the frame, we need to restore modified registers (rax and rbx) to their values in the calling function, then resume execution at the return address.
You could encode this in a table describing where to find each register’s original value, with one row per address:
| Address | rax | rbx | RA |
|---|---|---|---|
1 push rax | (unchanged) | (unchanged) | rsp+8 |
2 push rbx | rsp+8 | (unchanged) | rsp+16 |
| 3 | rsp+16 | rsp+8 | rsp+24 |
| 4 | rsp+16 | rsp+8 | rsp+24 |
| 5 | rsp+16 | rsp+8 | rsp+24 |
6 pop rbx | rsp+16 | rsp+8 | rsp+24 |
7 pop rax | rsp+8 | (unchanged) | rsp+16 |
| 8 | (unchanged) | (unchanged) | rsp+8 |
9 ret | (unchanged) | (unchanged) | rsp+8 |
The location of the original value of each register is defined as an offset from the stack pointer (rsp), which moves whenever items are pushed/popped from the stack. The return address (RA) is not an actual register (at least not on x64), but it is stored on the stack in a fixed location.
Note that in this simplified example the original values are always at some offset from rsp, but in reality this can be a more complicated expression. DWARF supports arbitrary expressions to retrieve (or calculate) the original value for a register.
You can immediately see there’s significant redundancy here: rows 3-6 and 8-9 are identical. We really only need the rows where something changes, i.e. immediately after a register is saved or restored. In this case that’s rows 2, 3, 7 and 8.
DWARF optimizes this by storing only these changed rows in a compact bytecode format. The actual bytecode is too detailed to cover here (see this excellent article for more details), but as pseudo-bytecode for our example:
// Initialize state
set_current_address(1)
set_return_address_location(rsp+8)

// Move to address 2 (1 + 1) and set the state
increment_current_address(1)
set_rax_location(rsp+8);
set_return_address_location(rsp+16);

// Move to address 3 (2 + 1) and set the state
increment_current_address(1)
set_rax_location(rsp+16)
set_rbx_location(rsp+8)
set_return_address_location(rsp+24);

// Move to address 7 (3 + 4) and set the state
increment_current_address(4)
set_rax_location(rsp+8)
clear_rbx_location()
set_return_address_location(rsp+16);

// Move to address 8 (7 + 1) and set the state
increment_current_address(1)
clear_rax_location()
set_return_address_location(rsp+8)
This greatly reduces data size at the cost of runtime execution: interpreting the bytecode reconstructs the (sparse) table on-demand, without storing it in full.
If you think this sounds like a lot of complicated machinery just to be able to get a stack trace, then you’re absolutely right. It’s one of the many tragic results from the decision in GCC’s past to compile optimized code with -fomit-frame-pointer by default, which means frame pointers (rbp) cannot be assumed to be present. This method is strictly inferior to rbp-based stack walking, but given the prevalence of -fomit-frame-pointer, it’s about the best that can be done currently.
The bytecode’s specific details aren’t critical here (see the linked article if curious); what matters is extracting the full unwind table from a binary as fast as possible. The reason for this is that our sampling code relies on this data to collect stack traces as described earlier: we won’t be able to collect samples until this data has been extracted. This can result in profiling data missing from the capture if this process takes too long.
So let’s get to optimizing it.
Baseline
Before doing any kind of optimization, it pays to have a reproducible baseline to compare any optimizations against. In this case, we’ll be extracting the unwind rows for a binary (libUnrealEditor-Engine.so, from UE5) with a total of 1,548,145 rows and 3,373,919 bytecode instructions across 154,361 functions.
We’re using libdwarf to iterate through all rows, and for our test code we’re only iterating; we’re not actually performing any other work as we would in a real scenario. This is so that we can profile just the iteration part. The main API in libdwarf to iterate through the unwind rows is dwarf_get_fde_info_for_all_regs3_b:
int dwarf_get_fde_info_for_all_regs3_b(Dwarf_Fde dw_fde,
    Dwarf_Addr       dw_pc_requested,
    Dwarf_Regtable3* dw_reg_table,
    Dwarf_Addr*      dw_row_pc,
    Dwarf_Bool*      dw_has_more_rows,
    Dwarf_Addr*      dw_subsequent_pc,
    Dwarf_Error*     dw_error);
This function can be used to iterate through the unwind rows for a single function in the binary (dw_fde). You give it the address you want the row for (dw_pc_requested) and it outputs the row for that address in dw_reg_table. It also outputs the address of the next row (dw_subsequent_pc), which can be used for the next query until the end of the table for this function is reached.
The code we’ll be profiling is thus something like the following (omitting memory management/error handling for simplicity):
Dwarf_Cie *cieList = nullptr;
Dwarf_Signed numCie = 0;
Dwarf_Fde *fdeList = nullptr;
Dwarf_Signed numFde = 0;
// Get the list of all FDEs (Frame Description Entry) in the file. This is the list of
// all functions that have .eh_frame entries associated with them.
dwarf_get_fde_list_eh(dwarfDebug, &cieList, &numCie, &fdeList, &numFde, nullptr);
// Set up register table. The register table is used by libdwarf to output information
// about the state of all registers after evaluating the .eh_frame data for a particular
// address (row). After evaluating the .eh_frame data, the data in this table can be used
// to determine how the value for each register should be calculated.
// We use a hardcoded 17 entries because we're only interested in registers RBP (6),
// RSP (7), and RA (16) for stack unwinding.
Dwarf_Regtable_Entry3_s registerEntries[17] = {};
Dwarf_Regtable3 registerTable = {};
registerTable.rt3_reg_table_size = 17;
registerTable.rt3_rules = registerEntries;
// Go through all FDE entries to extract the rules for each function
for (int fdeIndex = 0; fdeIndex < numFde; ++fdeIndex)
{
Dwarf_Fde fde;
dwarf_get_fde_n(fdeList, fdeIndex, &fde, nullptr);
// Get the address and size of this function
Dwarf_Addr functionStartAddress;
Dwarf_Unsigned functionLength;
dwarf_get_fde_range(fde, &functionStartAddress, &functionLength, nullptr, nullptr, nullptr, nullptr, nullptr, nullptr);
Dwarf_Addr currentRowRVA = functionStartAddress;
Dwarf_Bool hasMoreRows = false;
// Iterate through all rows for this FDE while there are more rows available
do
{
Dwarf_Addr rowRVA;
// Get row for the current address, which also outputs the address of the next
// available row
Dwarf_Addr nextRowRVA;
dwarf_get_fde_info_for_all_regs3_b(fde, currentRowRVA, ®isterTable, &rowRVA, &hasMoreRows, &nextRowRVA, &dwarfError);
// ... This is where you would normally do something with the row for the address
// that was just retrieved ...
// Move to the next available row
currentRowRVA = nextRowRVA;
} while (hasMoreRows);
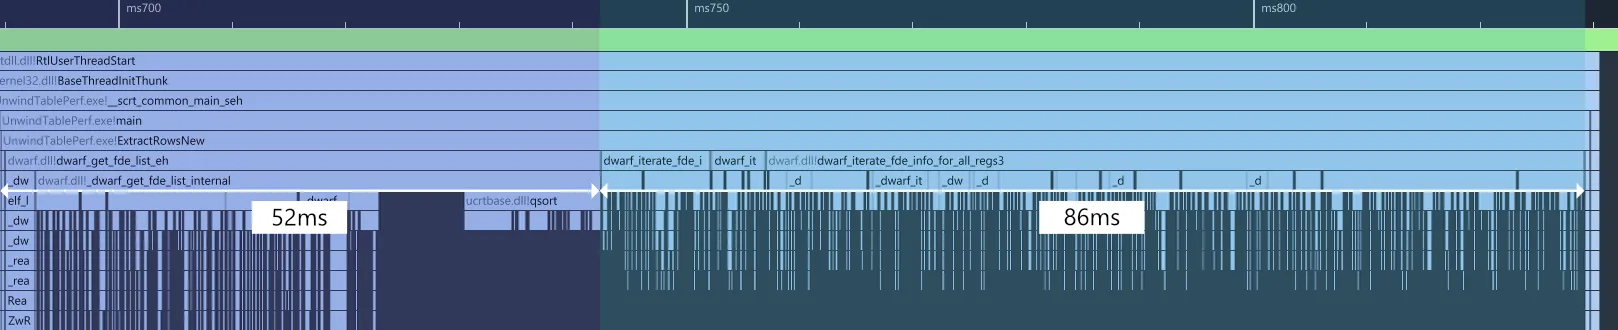
}When we profile this against our testcase, we get the following:
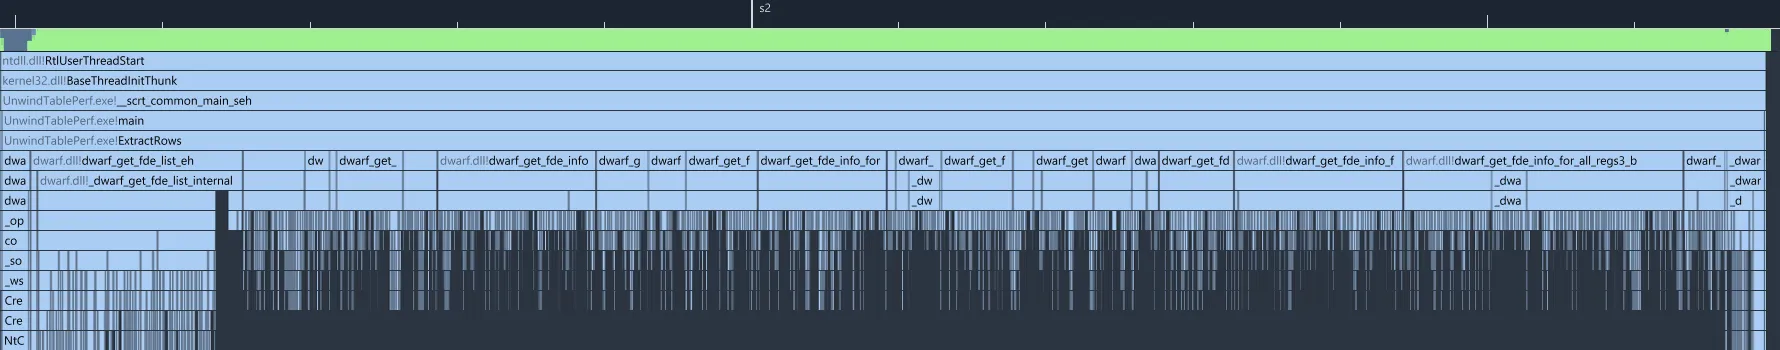
If you’re not familiar with Superluminal, this is showing the execution timeline of our test program. The X-axis here shows the actual wall-clock time, meaning the timeline shows you exactly in which order functions are executed. This is different from the standard flame (or icicle) graphs you may be familiar with, which only aggregate time. Execution order is often crucial information when profiling that can lead to new optimization insights.
Looking at the timeline, we can immediately spot a few things. Annotated version:
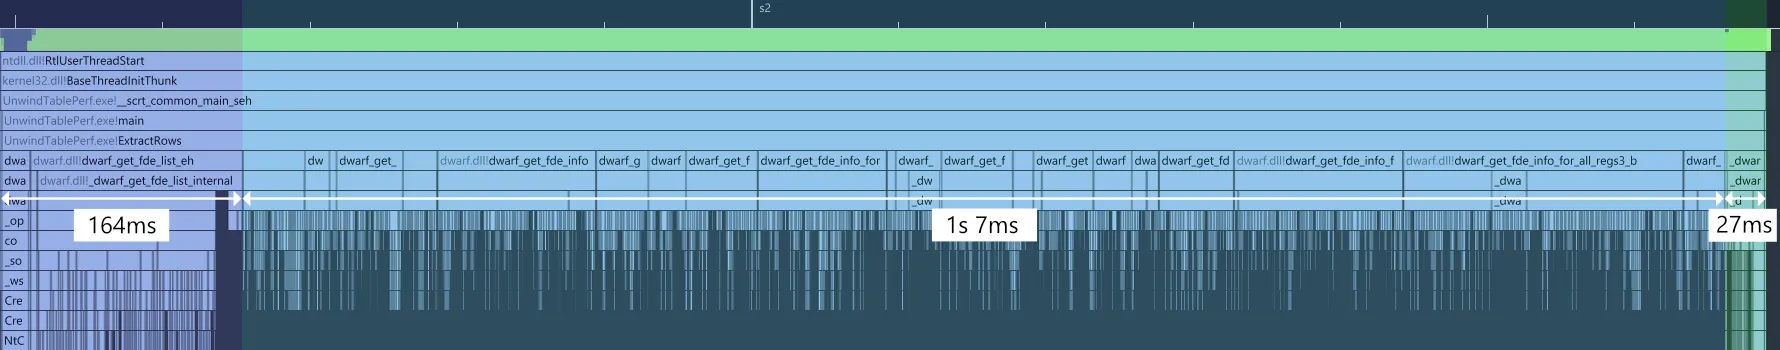
There are three distinct phases visible:
- The setup phase in purple (~164ms): a call to
dwarf_get_fde_list_eh, which is where libdwarf extracts the list of all functions (FDE) from the.eh_framesection - The extraction phase in blue (~1s 7ms): multiple calls to
dwarf_get_fde_info_for_all_regs3_b(one per function) which is where the unwind rows are extracted - The shutdown phase in green (~27ms): shutdown of libdwarf, where the .so file and related data is destroyed/unloaded
Putting this into a table for easy comparison with later optimizations, we get:
| Baseline | |
|---|---|
| Setup | 164 ms |
| Extract | 1007 ms |
| Shutdown | 27 ms |
| Total | 1198 ms |
This brings us to well over a second end-to-end to extract the ~1.5 million unwind rows from the binary, or about 774 nanoseconds per row. During this time, we won’t be able to capture any callstacks for this binary. Unacceptable!
Building understanding
It’s clear that the majority of time is going to the actual extraction of the unwind rows. There is some time spent in setup & shutdown, but it’s negligible in comparison. So let’s have a look at the extraction phase first.
Since this is not code written by us, we’ll start by building a better understanding of what’s actually happening behind the API function dwarf_get_fde_info_for_all_regs3_b that we’re calling in a loop to extract the unwind rows.
The callgraph for this part looks like this:
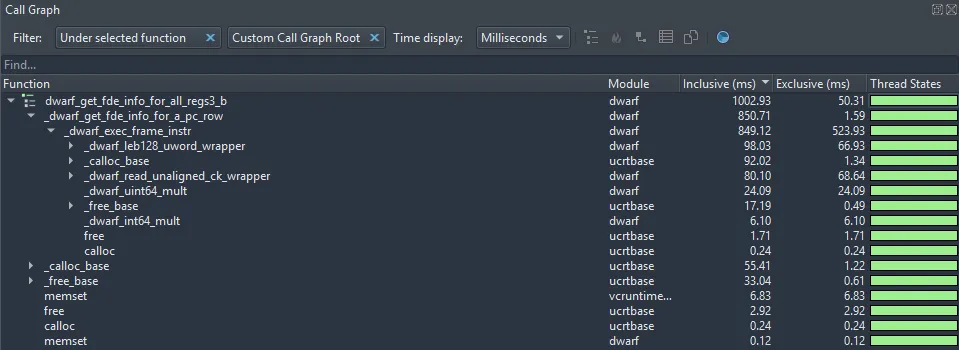
We can see that dwarf_get_fde_info_for_all_regs3_b spends the majority of its time (850ms out of 1002ms) calling an internal function _dwarf_get_fde_info_for_a_pc_row. This internal function doesn’t do much either; it does a little bit of setup work and then immediately calls _dwarf_exec_frame_instr.
_dwarf_exec_frame_instr is where the actual work happens and the majority of time is spent. It has a significant fraction (523ms out of 849ms) of exclusive time, meaning time spent only in this function, as opposed to any functions it calls. As its name implies, this is the inner loop function that interprets and executes the DWARF unwind bytecode, so the high exclusive time could be expected.
So far this is all pretty straightforward, but there are a few surprising things in this data.
First, ~206ms (out of ~1002ms) is spent in allocation-related functions (calloc, malloc, free).
Second, trivial helper functions are taking disproportionate time. For example, _dwarf_uint64_mult, a simple overflow-checked multiply, takes 24ms total. It looks like this, including per-line timings:
int
_dwarf_uint64_mult(Dwarf_Unsigned x, Dwarf_Unsigned y,
    Dwarf_Unsigned * result, Dwarf_Debug dbg,
    Dwarf_Error *error)
6.3%{
56.5%    if (y && (x > (ULLONG_MAX/y))) {
        _dwarf_error_string(dbg,error,
            DW_DLE_ARITHMETIC_OVERFLOW,
            "DW_DLE_ARITHMETIC_OVERFLOW "
            "unsigned 64bit multiply overflow");
        return DW_DLV_ERROR;
    }
3.1%    if (result) {
16.1%        *result = x*y;
    }
6.3%    return DW_DLV_OK;
11.8%}
56% of 24ms on a simple branch and 16% on a multiply feels off, especially with significant time in prologue/epilogue.
For such trivial operations to consume this much time suggests they’re being called far more often than expected. This points at an underlying issue, so let’s investigate further.
Finding the bottleneck
Let’s first try to deepen our understanding of the work that the inner _dwarf_exec_frame_instr function is doing. As mentioned, this function is responsible for doing the actual work of interpreting the bytecode stream, so it is expected that most of the execution time is going here. It takes an (optional) search_pc_val argument, which is the address of the row that the calling function is looking for.
In our case, we’re calling dwarf_get_fde_info_for_all_regs3_b repeatedly, which internally calls _dwarf_exec_frame_instr with search_pc_val set to the address of the row we want the unwind information for. We described earlier in this article how the result of interpreting the bytecode is essentially a table, but importantly, there is no actual table in the data. So the question is: how does _dwarf_exec_frame_instr look for the row matching search_pc_val?
The answer is simple: it executes the bytecode starting from the first instruction of the relevant function’s instruction stream until it encounters a DW_CFA_advance_loc instruction that advances the current location (= address) past the search_pc_val we’re looking for. At that point, the previous row is “complete” and must be the row that matches search_pc_val, so the function returns.
If we collapse all these abstraction layers and helper functions, it turns out we effectively have three nested loops. In pseudo code:
for each function:
    for each row in function:
        for each instruction in function:
            execute instruction
            if current location > search_pc_val:
                break
The outer loop iterates all functions in the binary. The middle iterates all rows per function (via dwarf_get_fde_info_for_all_regs3_b). Finally, the inner looks up row data for a given address (via _dwarf_exec_frame_instr). That inner function (_dwarf_exec_frame_instr) keeps no state, so it has to start interpreting the instruction stream from the start each time.
If you’re familiar with algorithmic complexity, alarm bells should be ringing in your head right about now: this is a classic case of (accidental) quadratic complexity.
Back-of-the-envelope overhead calculation for this binary, given we have:
- 3,373,919 bytecode instructions
- 1,548,145 unique rows
- 154,361 functions
This means that each function has an average of 3,373,919 / 154,361 = ~22 bytecode instructions per function. Executing those bytecode instructions will output 1,548,145 rows / 154,361 = ~10 rows per function on average.
Since we now know that extracting each row for a function involves executing all bytecode instructions from the start, this means that each function requires roughly 10 rows * 22 bytecode instructions = ~220 bytecode instruction executions on average instead of the linear ~22.
Across 154,361 functions, this means we’re executing approximately 34 million bytecode instructions instead of the linear 3.4 million. That’s a ~10x overhead purely from the quadratic behavior. This also explains why trivial functions like _dwarf_uint64_mult are more prominent in the profile than you’d expect: they’re indeed being called way too often as we suspected.
_dwarf_exec_frame_instr was most likely initially written with the use case of infrequent lookups to get the unwind data for a single address in mind, for example, for a debugger to unwind the stack on a breakpoint. For that case, the inherent linear search is fine, or at least not as noticeable. Later on, the function to extract all rows for a binary was added, which made use of the already existing function without realizing that this turned it into a quadratic loop.
This happens a lot in software development: the use case for which code was originally written changes or is expanded, often by people other than the original author, which violates (hidden) assumptions the old code was operating under, leading to (perf) issues. In this case, looking up the unwind data for a single address vs extracting all rows for a binary are fundamentally different use cases, so the code should be rearchitected with both use cases in mind.
Fixing this is fortunately fairly straightforward: instead of a function that can be used to repeatedly retrieve the unwind data for a row (the existing dwarf_get_fde_info_for_all_regs3_b) we’ll introduce a new function dwarf_iterate_fde_info_for_all_regs3 (commit 6668cff). The new function iterates through all the rows for a given function in a single pass and invokes a callback for each new row (i.e. whenever a DW_CFA_advance_loc instruction is encountered). The callback can then be used by the caller to do something with the row. The usage of the new function looks like this:
for (int fdeIndex = 0; fdeIndex < numFde; ++fdeIndex)
{
    Dwarf_Fde fde;
    dwarf_get_fde_n(fdeList, fdeIndex, &fde, nullptr);

    dwarf_iterate_fde_info_for_all_regs3(fde, regTableSize, [](Dwarf_Addr dw_row_pc, Dwarf_Regtable3* dw_reg_table, void* dw_user_data)
    {
        // ... This is where you would normally do something with the row for the address
        // that was just retrieved ...
    }, nullptr, nullptr);
}
With this change, the inner iteration becomes linear instead of quadratic. Profiling this again results in the following:
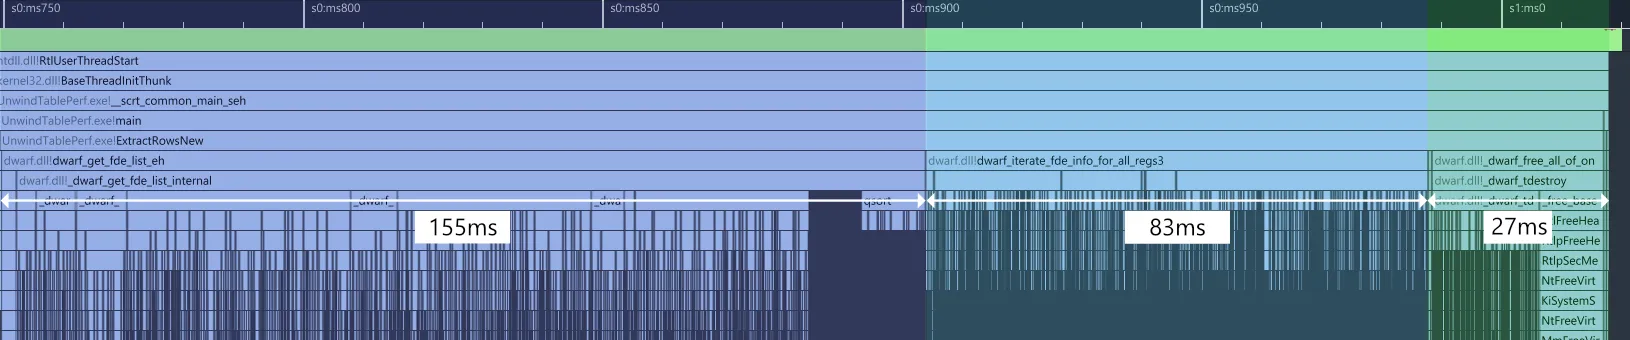
This makes a massive difference. The setup & shutdown phases are roughly unchanged, which makes sense since we haven’t done any work there yet. The new function dwarf_iterate_fde_info_for_all_regs3, however, takes 83ms vs the previous 1007ms. That’s 12x faster, which is pretty close to our ~10x overhead napkin math! Looking at the callgraph (not pictured), smaller helper functions like _dwarf_uint64_mult are entirely gone from the profiler as expected.
Adding this to our optimization timings table, we’re now at a total of 4.5x faster:
| Baseline | Linear iteration | Total speedup | |
|---|---|---|---|
| Setup | 164 ms | 155 ms | 1.05x |
| Extract | 1007 ms | 83 ms | 12x |
| Shutdown | 27 ms | 27 ms | 1x |
| Total | 1198 ms | 265 ms | 4.5x |
After this optimization, setup & shutdown now dominate the total time. So let’s look at those next.
The setup phase takes 164ms in the baseline profile, ~140ms of which is spent in the function dwarf_get_fde_list_eh. The callgraph for that looks like this:
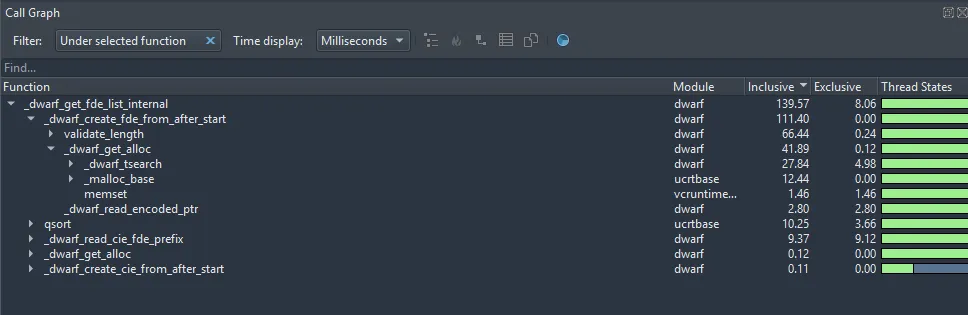
There are a few things we can immediately pick out from this graph, even without knowing the underlying code:
- The majority of time is spent in
_dwarf_create_fde_from_after_start. - More time than expected is spent in what seems to be a validation function (66ms in
validate_length) - Allocation is accounting for another significant percentage of the time (41ms in
_dwarf_get_alloc)
Death by a thousand strings
Let’s look at the 66ms in validate_length first, again including the per-line timings:
static void
validate_length(Dwarf_Debug dbg,
    Dwarf_Cie cieptr, Dwarf_Unsigned length,
    Dwarf_Unsigned length_size,
    Dwarf_Unsigned extension_size,
    Dwarf_Small * section_ptr,
    Dwarf_Small * ciefde_start,
    const char * cieorfde)
{
    Dwarf_Unsigned address_size = 0;
    Dwarf_Unsigned length_field_summed = length_size + extension_size;
    Dwarf_Unsigned total_len = length + length_field_summed;
    Dwarf_Unsigned mod = 0;

    if (cieptr) {
        address_size = cieptr->ci_address_size;
    } else {
        address_size = dbg->de_pointer_size;
    }
    mod = total_len % address_size;
    if (mod != 0) {
        dwarfstring  harm;
        Dwarf_Unsigned sectionoffset = ciefde_start - section_ptr;

        dwarfstring_constructor(&harm);
        if (!cieorfde || (strlen(cieorfde) > 3)) {
            /*  Coding error or memory corruption? */
            cieorfde = "ERROR!";
        }
27.45%        dwarfstring_append_printf_u(&harm,
            "DW_DLE_DEBUG_FRAME_LENGTH_NOT_MULTIPLE"
            " len=0x%" DW_PR_XZEROS DW_PR_DUx,
            length);
7.51%        dwarfstring_append_printf_u(&harm,
            ", len size=0x%"  DW_PR_XZEROS DW_PR_DUx,
            length_size);
7.33%        dwarfstring_append_printf_u(&harm,
            ", extn size=0x%" DW_PR_XZEROS DW_PR_DUx,
            extension_size);
6.04%        dwarfstring_append_printf_u(&harm,
            ", totl length=0x%" DW_PR_XZEROS DW_PR_DUx,
            total_len);
6.97%        dwarfstring_append_printf_u(&harm,
            ", addr size=0x%" DW_PR_XZEROS DW_PR_DUx,
            address_size);
11.71%        dwarfstring_append_printf_u(&harm,
            ", mod=0x%" DW_PR_XZEROS DW_PR_DUx " must be zero",
            mod);
2.37%        dwarfstring_append_printf_s(&harm,
            " in %s",(char *)cieorfde);
8.78%        dwarfstring_append_printf_u(&harm,
            ", offset 0x%" DW_PR_XZEROS DW_PR_DUx ".",
            sectionoffset);
18.30%        dwarf_insert_harmless_error(dbg,
            dwarfstring_string(&harm));
2.92%        dwarfstring_destructor(&harm);
    }
    return;
0.18%}
So that’s…unexpected.
validate_length first checks whether the length of the field is a multiple of the address size (mod = total_len % address_size;). This takes no time at all as you’d expect. But if the length isn’t a multiple of the address size, it then builds up an error string and inserts what libdwarf calls a ‘harmless error’ with that string via dwarf_insert_harmless_error. What’s more, nearly 100% of the time in this function is spent just on building these error strings.
Investigating further into libdwarf’s harmless errors reveals that these are intended for use in (unit) tests: the errors that are checked like this are harmless in normal operation, hence the name. The library already has proper handling for each of these cases and correctly deals with them if they do occur.
The harmless error reporting is enabled by default, probably because it’s assumed that they don’t occur frequently. In this particular binary, however, there are apparently many of these errors, which is why it’s taking so much time. In normal non-test production uses, this is just a waste.
Fortunately, the fix is simple: we introduce a new function dwarf_set_harmless_errors_enabled that can be used to disable this behavior (commit 7f4f410). All uses of harmless errors now first check whether harmless errors are enabled. If not, the harmless error path is skipped.
Profiling again with harmless errors disabled shows that validate_length is entirely gone from the profile, bringing us to:
| Baseline | Linear iteration | Harmless errors | Total speedup | |
|---|---|---|---|---|
| Setup | 164 ms | 155 ms | 98 ms | 1.6x |
| Extract | 1007 ms | 83 ms | 83 ms | 12x |
| Shutdown | 27 ms | 27 ms | 27 ms | 1x |
| Total | 1198 ms | 265 ms | 208 ms | 5.8x |
The cost of convenience
Next up is 41ms in _dwarf_get_alloc. The code is a bit too large to copy here, but looking at the function, it does two things:
- It allocates memory using the system allocator via
malloc(30% of the time) - It stores the allocated pointer in a data structure via
_dwarf_tsearchbefore returning it to the caller of_dwarf_get_alloc(66% of the time)
We can’t do much about the malloc itself without drastic, potentially breaking changes, but we might be able to do something about the data structure.
Looking into _dwarf_tsearch, it turns out that this is really just for convenience: libdwarf ensures that when the Dwarf_Debug object is destroyed via dwarf_finish all memory allocated by it is freed automatically. This frees callers from having to worry about freeing memory returned by libdwarf API functions, but the price of that is that every single alloc made by libdwarf internally needs to be tracked via _dwarf_tsearch (and removed later on when it’s freed), which is clearly not free.
In our case, we’re already properly manually freeing memory, so we’re basically paying this cost for no reason. Fortunately, looking at the code for _dwarf_get_alloc we see this:
0.29%if (global_de_alloc_tree_on) {
66.45%    result = dwarf_tsearch((void *)key,
        &dbg->de_alloc_tree,simple_compare_function);
    if (!result) {
        /*  Something badly wrong. Out of memory.
            pretend all is well. */
    }
}
So, this behavior of tracking allocations is already behind a flag (global_de_alloc_tree_on). Looking at the libdwarf API, we can disable that flag via dwarf_set_de_alloc_flag(0), thus saving us the time spent tracking allocations during allocs/frees.
Victory
Profiling again with all of our changes together, we get this:
Note how there’s only 2 phases left now: setup in purple and extraction in blue. This is because the shutdown phase is too small to see anymore. The majority of the time in the shutdown phase was spent on freeing the nodes in the data structure that libdwarf uses to keep track of allocations. By disabling the allocation tracking functionality, we’ve therefore also optimized the shutdown; it now takes just 0.492ms.
This gets us to the final result of:
| Baseline | Linear iteration | Harmless errors | Allocation tracking | Total speedup | |
|---|---|---|---|---|---|
| Setup | 164 ms | 155 ms | 98 ms | 52 ms | 3x |
| Extract | 1007 ms | 83 ms | 83 ms | 86 ms | 12x |
| Shutdown | 27 ms | 27 ms | 27 ms | 0.5 ms | 54x |
| Total | 1198 ms | 265 ms | 208 ms | 138.5 ms | 8.6x |
So we’re now a total of 8.6x faster than the baseline, which comes down to about 89 nanoseconds per row. This means we could extract a bit over 11 million rows per second after our optimizations, compared to about 1 million rows per second before.
While there is some room to push this even further by making more invasive changes, it’s good to remember we’re working with a widely used existing library. We’d like to be able to upstream optimizations we make (PR #308 and #309), but invasive changes could break existing clients, which makes the barrier for upstream adoption much higher.
So, we’ll call the 8.6x speedup good enough for now.
That’s it!